© A.W.Marczewski 2002
A Practical Guide to Isotherms of ADSORPTION on Heterogeneous Surfaces
Reload Titration
See also practical How to calculate ...
Sample and setup
Solid sample: lessive soil fraction (code G3f1) (99.7% of the total; fraction separation by Kohn method: particle size 0.1-0.2 mm).
Sample preparation and measurement: B.Kowalczuk, MSc Thesis (this laboratory).
Composition: mainly quartz, silicates, some aluminosilicates
Properties: SBET=15 m2/g, total pore volume 0.02 cm3/g, micropore volume 0.0006 cm3/g, mean (hydraulical) pore size ~5.2 nm.
Electrolyte: 50 cm3 of 0.1 mol/dm3 NaCl, initial pH established by addition of 1 cm3 of 0.1 mol/dm3 HCl; titrant - 0.1 mol/dm3 NaOH.
Titration data: titrations of 2 masses (0.2 g and 1 g) of soil compared with electrolyte titration.
Measurement: automatic burette Dosimat 665 (Metrohm, Switzerland), digital pH-meter pHm-240 (Radiometer, Copenhagen), pH standards - Radiometer. Data collection and burette driving by a computer program (W. Janusz, this laboratory).
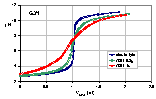 Titration of lessive soil fraction - raw data
Two masses of soil were titrated in electrolyte with NaOH titrant as described above. For comparison, the titration of electrolyte without soil is also shown. The titration point lying to the right of respective electrolyte titration (for the same pH) corresponds to the increase in base consumption (more protons available in the system), points to the left indicate that the system is more alkaline than electrolyte (less protons available). The points where the titration curves meet is called CIP (common intersetion point). If this point lies on electrolyte titration curve, this point is also a PZC (point of zero charge). If CIP is not on electrolyte curve it means, that in this pH range the impurities and/or solid dissolution must be taken into account. This effect may be determined only if at least two titrations of solid with different masses are performed. Otherwise, the calculated values of surface charge, qs, and pHPZC will be false.
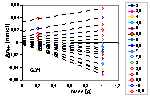 Proton balance for titration of lessive soil fraction
The points denote actual values of ΔnH+ for two masses of soil calculated from raw data at fixed pH (indicated). Y-intercept of dashed lines give the balance of protons (positive - protons are donated by the solid) corresponding to the total effect of dissolution of solid and/or impurities on pH and slope of lines gives actual surface charge of the remaining solid.
See practical instruction how to calculate acid/base balance.
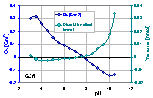 Surface charge and dissolution effect of lessive soil fraction
The surface charge, Qs and proton balance related to the dissolution effects (soil contains e.g. silica soluble in strong bases).
The silica dissolution edge is well visible at pH > 8.
See practical instruction how to calculate surface charge and sample dissolution.
Equipment for potentiometric titrations
Basic links for good titration equipment:
- Radiometer Analytical - titration, pH-, conductivity meters, electrodes etc.
- Metrohm - ion analysis (titration, pH-, conductivity meters, electrodes, autoburettes etc.)
- Beckman Coulter (alt1, alt2) - equipment etc. for bio-medical and chemical applications and research, analytical chemistry (e.g. titration, pH-, conductivity meters, electrodes etc.; particle & surface area analysis etc.)
More on the equipment we use for various purposes may be found on my
Department page
(access may be blocked by some firewall software, e.g. NIS!!!) or its
fast mirror.
Top
Main titration page | How to calculate surface charge
My papers
Search for papers
Main page
E-mail addresses are modified to in order to prevent spamming / mail-abuse:
in e-mail remove spaces, replace " AT@AT " by "@"
Send a message to Adam.Marczewski AT@AT umcs.lublin.pl
Disclaimer
 Titration of lessive soil fraction - raw data