© A.W.Marczewski 2002
A Practical Guide to Isotherms of ADSORPTION on Heterogeneous Surfaces
Potential Curves for DR isotherm
NOTE
Characteristic micropore-filling concentration co is smaller than cs (concentration of saturated solution). Analogously, for vapours, po < ps.

In a so-called "potential adsorption theory" of Eucken and Polany'i, it is assumed that in the space around each solid one may find some isopotential surfaces (for flat homogeneous surfaces they are planes) delimiting adsorbate which is adsorbed at pressures (or concentrations) lower than those corresponding to the potential value and that such isopotential surfaces are specific for a given solid surface. If a plot is made of adsorbed volume (amount of condensed adsorbate) vs. adsorption potential, then such "potential curve" is characteristic for a given system. At the same time, it was proved experimentarily, that for a given solid surface and a series of adsorbates and adsorption temperatures, their plots may be scaled in such a way, that all experimental points fit a single curve (in fact also for many different solids this also proved true). In such a case, a so called adsorption-limiting volume Vs (i.e. maximum adsorbed volume, or a volume adsorbed at A=0 - may be different for each solid/adsorbate system) is used to scale adsorbed volume.
Legend. The course of Dubinin-Radushkevich (DR) isotherm corresponds to the typical shape of characteristic potential curve found for microporous solids. In the following pictures, the characteristic potential curves obtained for T = 293K and 3 different B2 values are presented ( B2 = 3e-9; 1e-8; 3e-8 - it corresponds to B2(RT)2 = 0.0178; 0.0593; 0.178 or - if one prefers to use log10 scaling - B2[ln(10) RT]2 = 0.0944; 0.315; 0.944 ).
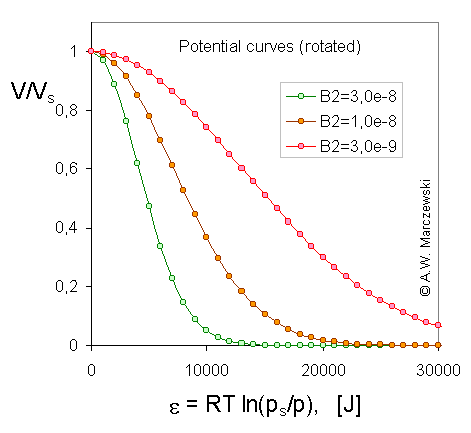 Rotated and scaled model potential curves, adsorbate volume (V/Vs) vs. A, adsorption potential [J], calculated for Dubinin-Radushkevich isotherm, T = 293K and 3 values of B2 parameter (see legend).
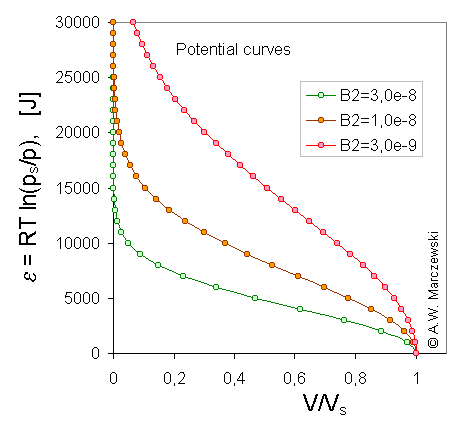 Scaled model potential curves, A, adsorption potential [J] vs. adsorbate volume (V/Vs), calculated for Dubinin-Radushkevich isotherm, T = 293K and 3 values of B2 parameter (see legend).
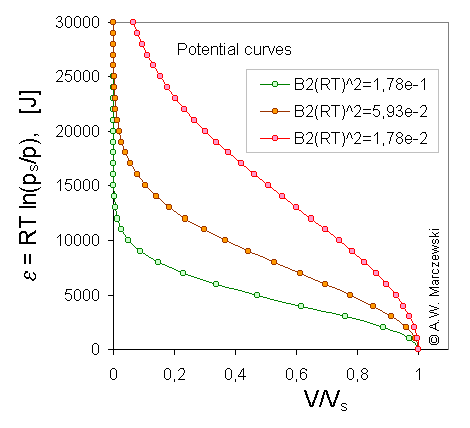 Scaled model potential curves, A, adsorption potential [J] vs. adsorbate volume (V/Vs), calculated for Dubinin-Radushkevich isotherm, T = 293K and 3 values of B2 parameter (the same B2 as above; in the picture the values of B2(RT)2 are shown) (see legend).
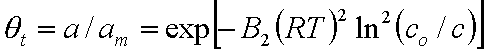
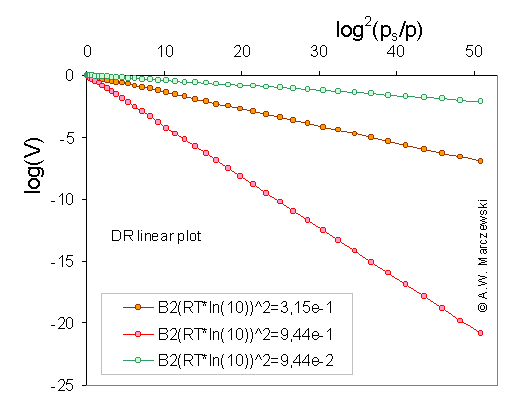 Linear Dubinin-Radushkevich plot: log10(V) vs. [log10(ps/p)]2 , calculated for Dubinin-Radushkevich isotherm, T = 293K and 3 values of B2 parameter (in the picture the values of B2(ln10 RT)2 are shown) (see legend). One has to be always aware which form of DR equation is used. In evaluation of experimental data this decimal logarithms are often used, however such obtained values of (slope is = B2(ln10 RT)2 ) parameters are scaled when compared to natural logarithm plots (slope is = B2(RT)2 ). Sometimes DR equation is defined in such a way, that the "convoluted" parameter B = B2(RT)2 is used, however, it hides the fact that the structural parameter B2 is temperature independent.
Top
My papers
Search for papers
Main page
Send a message to Adam.Marczewski AT@AT umcs.lublin.pl


