 αs method
© A.W.Marczewski 2002
A Practical Guide to Isotherms of ADSORPTION on Heterogeneous Surfaces
αs method
Details of the method and an example of standard isotherm may be found e.g. in:
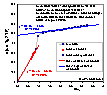
αs method was introduced by K.S.W. Sing. In some respects it is very similar to the de Boer's t-plot method, because it compares your adsorption data with a standard isotherm of adsorption on some non-porous solid. It is also assumed, that the adsorption in a certain region may be described by a straight line in which a y-intercept describes a saturated adsorption isotherm on micropores (i.e. maximum adsorption in micropores), whereas the slope is related to the adsorption on a non-microporous part. However, in contrast to the t-plot method, the standard isotherm in αs-plot is usually some experimental isotherm on a non-porous adsorbent selected specifically for its chemical and structural similarity to the adsorbent in question.
The main equation of αs-plot may be written as:
a(x) = amicro,max + kstd Sext αs(x)
or
a(x) = amicro,max + slope * αs(x)
where:
x = p/ps
amicro,max - adsorption in saturated micropores,
Sext - "external" surface area; here it is the surface area of pores larger than micropores,
αs(x) = astd(x) / astd(x=0.4) (dimensionless value)
kstd = astd(x=0.4) / Sstd - where Sstd is specific surface area of the standard used; its numerical value depends on the units used for the values of adsorption a(x) and surface area S.
Then the external surface area of the adsorbent may be calculated as:
Sext = slope [ Sstd / astd(x=0.4) ]
Another positive side of αs method is its universality. It may be used in determination of mesopore volume, mesopore surface area, macropore volume and area etc. - it depends only on the data range available (in fact t-plot could be used in a similar manner as well). However, it also helps if pore size distribution has well defined peaks, i.e. there may be several types of quite distinct pores, without much of intermediates.
A series od lines approximating isotherm sections may be drawn:
a(x) = ao,i + slopei αs , i = 1, 2 ...
Those lines may be interpreted as follows:
As opposed to the original αs method as proposed originally and used for N2 adsorption (some authors still use x=0.4 for e.g. benzene), the αs should be defined differently:
αs(x) = astd(x) / astd(x=xhist) (dimensionless value)
The point of opening/closing of hysteresis loop xhist changes strongly with adsorbate (e.g. 0.4 for nitrogen, 0.175 for benzene). However, this changed value still corresponds to the point where the adsorbed layer is at least monoatomic and the micropores are filled-up. As of now I believe the problem is still open for discussion whether just xhist is the best choice for characteristic point in αs method. However it is still the simplest and the most logical one.
Some standard isotherms for nitrogen, benzene and n-hexane adsorption on carbonaceous adsorbents may be found e.g. in:
Send a message to Adam.Marczewski AT@AT umcs.lublin.pl